6.5 Inequality
Income and wealth inequality, how the Lorenz curve and Gini coefficient compare distributions, and sources of inequality from skills to tax structure.
Part 1 of 3 Measuring Inequality
Income is what a household earns over a period, such as wages, interest and rent. Wealth is what a household owns at a point in time, minus what it owes. Income levels and poverty rates differ widely across countries, and across and within groups such as age, gender and race.
A Lorenz curve shows how evenly income or wealth is spread. Households are lined up from poorest to richest along the horizontal axis, and the curve shows what share of the total the poorest group holds. If every household had the same income, the curve would follow the diagonal line of equality. The farther the curve sags below that line, the more unequal the distribution.
The Gini coefficient sums up the Lorenz curve in one number from 0 to 1. A Gini of 0 means perfect equality, and a Gini of 1 means one household has everything. The farther the Lorenz curve sags below the line of equality, the higher the Gini coefficient.
Part 2 of 3 Two Countries Compared
Vellmar and Ostrin are two fictional countries with the household income shares below. The Lorenz curve and the Gini coefficient let economists compare distributions across countries, policies or time periods.
| Households | Vellmar share | Vellmar cumulative | Ostrin share | Ostrin cumulative |
|---|---|---|---|---|
| Poorest fifth | 8% | 8% | 4% | 4% |
| Second fifth | 13% | 21% | 9% | 13% |
| Middle fifth | 18% | 39% | 14% | 27% |
| Fourth fifth | 23% | 62% | 21% | 48% |
| Richest fifth | 38% | 100% | 52% | 100% |
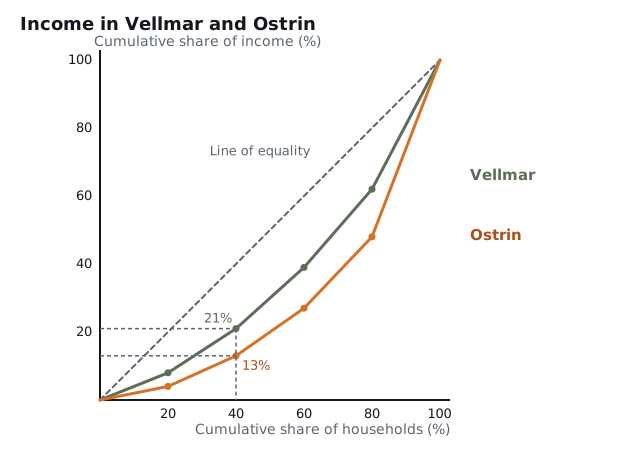
In Vellmar, the poorest 40% of households earn 21% of income. In Ostrin they earn 13%. Ostrin's Lorenz curve sags further below the line of equality, so Ostrin has the higher Gini coefficient and less equal income.
Part 3 of 3 Sources of Inequality
In a competitive factor market, each factor of production earns the value of its marginal product. Workers and owners whose factors add more value earn more, and that link between pay and marginal product can contribute to income inequality.
| Source | How it widens or narrows the gap |
|---|---|
| Tax structure | A progressive tax takes a larger share of income from higher earners; a regressive tax takes a larger share from lower earners |
| Human capital | Education, training and skills raise a worker's marginal product and pay |
| Social capital | Networks of contacts and trust open doors to jobs and deals |
| Inheritance | Wealth passed down gives some households a head start |
| Discrimination | Unequal treatment can hold down the pay and opportunities of some groups |
| Access to financial markets | Households that can borrow and invest can build wealth faster |
| Mobility | Ease of moving to better jobs or places affects how far households can rise |
| Bargaining power | Power within firms, labor unions and families shapes who gets what share |
These sources build on each other over time. A family with wealth can pay for more education, which raises its children's human capital and pay, which lets them save and pass on more wealth in turn. Tax and transfer policies can push the other way: a progressive tax narrows the gap in income after taxes, while a regressive tax widens it.
Inequality has many sources, and a Lorenz curve shows the combined result.
Key Terms
Practice Questions
5 questions. Nothing here is recorded or scored.
- Question 1POL-5.A.2
The Lorenz curve for the country of Pellagra lies farther below the line of equality than the Lorenz curve for the country of Duvane. What does this show?
- A.Income is distributed less equally in Pellagra than in Duvane.
- B.Average income is lower in Pellagra than in Duvane.
- C.Pellagra has a lower Gini coefficient than Duvane.
- D.Income is distributed more equally in Pellagra than in Duvane.
Check answerHide answer
Answer: A
- A.
- Correct. The farther a Lorenz curve sags below the line of equality, the smaller the share of income held by lower-income households, so the distribution is less equal.
- B.
- A Lorenz curve shows how income is shared among households. It says nothing about average income.
- C.
- A Lorenz curve farther from the line of equality means a higher Gini coefficient, which shows less equal income.
- D.
- A curve closer to the line of equality shows a more equal distribution. Pellagra's is farther away.
- Question 2POL-5.B.2
Which income tax is progressive?
- A.Every household pays 12% of its income.
- B.Rates rise from 5% to 15% to 25% as household income rises.
- C.Every household pays a flat $1,000 a year.
- D.Households pay 20% on incomes under $30,000 and 10% above that.
Check answerHide answer
Answer: B
- A.
- A single rate on all incomes takes the same share from every household, which is a proportional tax.
- B.
- Correct. A progressive tax takes a larger share of income from higher-income households. Here the rate rises from 5% to 15% to 25% as income rises.
- C.
- A flat $1,000 is a larger share of a small income than of a large one, so it is regressive.
- D.
- A rate that falls as income rises takes a larger share from lower incomes, so it is regressive.
- Question 3POL-5.B.2
A sales tax applies to groceries, and lower-income households spend a larger share of their income on groceries than higher-income households do. How is the tax best described?
- A.Progressive, because higher-income households pay more dollars of tax
- B.Proportional, because everyone pays the same rate on each purchase
- C.Regressive, because it takes a larger share of income from lower-income households
- D.Neutral, because it has no effect on inequality
Check answerHide answer
Answer: C
- A.
- A tax is classified by the share of income it takes. The dollar amount paid does not decide the class.
- B.
- The rate per purchase is the same, but lower-income households spend more of their income on taxed goods, so the share of income taken differs.
- C.
- Correct. Lower-income households spend a larger share of their income on groceries, so the sales tax takes a larger share of their income. A tax that takes a larger share from lower incomes is regressive, and it can widen inequality after taxes.
- D.
- A regressive tax widens the gap in after-tax income.
- Question 4POL-5.B.1
In competitive labor markets, software engineers earn much more than restaurant servers. Which explanation fits the idea that factors are paid the value of their marginal product?
- A.Engineers work more hours each week than servers.
- B.Servers face higher taxes than engineers.
- C.Employers prefer engineers for reasons unrelated to output.
- D.An engineer's hour adds more value to output than a server's hour.
Check answerHide answer
Answer: D
- A.
- Hours worked affect total pay, but the question compares the value each worker adds, which sets the wage rate.
- B.
- Taxes affect income after taxes. The question asks about the wage paid by employers.
- C.
- Preferences unrelated to output would be discrimination. The marginal-product idea links pay to the value of what a worker adds.
- D.
- Correct. In competitive factor markets, each factor receives the value of its marginal product. Engineers' work adds more value per hour, so their wage is higher, and differences like this can contribute to income inequality.
- Question 5POL-5.A.2
Income in Marlo
The table shows the share of national income earned by each fifth of households in the country of Marlo.
Households | Share of income Poorest fifth | 5% Second fifth | 10% Middle fifth | 15% Fourth fifth | 25% Richest fifth | 45% On Marlo's Lorenz curve, what cumulative share of income corresponds to the poorest 40% of households?
- A.10%
- B.30%
- C.15%
- D.45%
Check answerHide answer
Answer: C
- A.
- 10% is the second fifth's share alone. The cumulative share adds the poorest fifth's 5%.
- B.
- 30% adds the poorest three fifths, which is 60% of households.
- C.
- Correct. The poorest 40% of households are the poorest two fifths, so their cumulative share is 5% + 10% = 15%.
- D.
- 45% is the richest fifth's share.
Practice every topic in Unit 6
CED Codes
POL-5.A.1 · POL-5.A.2 · POL-5.B.1 · POL-5.B.2