4.7 The Loanable Funds Market
Draw the loanable funds market, define national savings in closed and open economies, and show how saving and borrowing move the real interest rate.
Part 1 of 4 Savers and Borrowers
The loanable funds market describes the behavior of savers and borrowers. Savers supply funds; borrowers demand them. The price that balances the two is the real interest rate, so the vertical axis shows the real interest rate and the horizontal axis shows the quantity of loanable funds.
The demand for loanable funds slopes downward. A firm borrows to build a project only if the project earns more than the interest. At a 9% real rate, few projects pass that test. At 3%, many do. The supply of loanable funds slopes upward. A higher real rate rewards saving more, so households save a larger share of income.
Part 2 of 4 Where the Funds Come From
Without international borrowing and lending, the funds available equal national savings: private savings plus public savings. Private savings is what households and firms keep after taxes and spending. Public savings is the government's budget balance, and a budget deficit makes public savings negative.
An open economy can also draw on foreign savers. Investment then equals national savings plus net capital inflow, the foreign funds coming in minus domestic funds going out.
| Item | Amount |
|---|---|
| Private savings | 900 |
| Public savings (a budget deficit of 250) | -250 |
| National savings | 900 - 250 = 650 |
| Net capital inflow | 100 |
| Investment | 650 + 100 = 750 |
Part 3 of 4 Equilibrium in Loanable Funds
Equilibrium is the real interest rate at which the quantity of loanable funds demanded equals the quantity supplied. Above that rate, savers offer more than borrowers want: a surplus of funds. Lenders compete for borrowers, and the real rate falls. Below that rate, borrowers want more than savers offer: a shortage. Borrowers compete for funds, and the real rate rises.
Part 4 of 4 What Shifts the Curves
| Change | Shift | Real interest rate |
|---|---|---|
| An investment tax credit makes more projects profitable | Demand shifts right | Rises |
| Firms expect lower profits | Demand shifts left | Falls |
| Households decide to save a larger share of income | Supply shifts right | Falls |
| Foreign savers send more funds into the country | Supply shifts right | Falls |
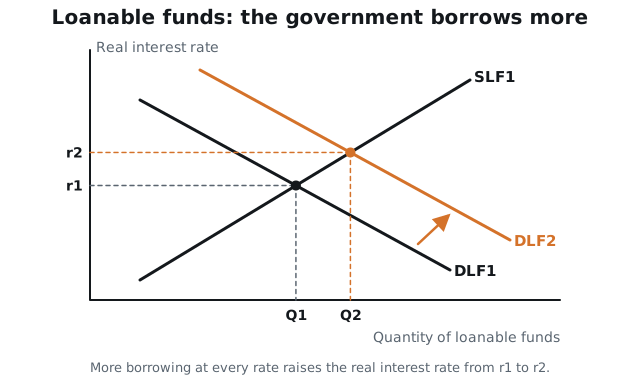
| The government borrows more to cover a deficit | Demand shifts right, or supply shifts left | Rises |
The loanable funds market shows how government spending, taxes and borrowing affect interest rates. A larger deficit can be drawn two ways. As borrowing, it shifts demand right. As lower public savings, it shifts supply left. Both drawings raise the real interest rate. Topic 5.5 follows that higher rate to its effect on private investment.
More saving lowers the real interest rate. More borrowing raises it.
Key Terms
Practice Questions
6 questions. Nothing here is recorded or scored.
- Question 1MKT-4.B.1
Saving in Brevonia
The imaginary country of Brevonia has no international borrowing or lending. In one year, private savings is $600 billion. The government collects $1,500 billion in taxes and spends $1,700 billion on purchases and transfer payments.
What is national savings in Brevonia for the year?
- A.$200 billion
- B.$400 billion
- C.$600 billion
- D.$800 billion
Check answerHide answer
Answer: B
- A.
- This is the size of the budget deficit. National savings adds public savings to private savings.
- B.
- Correct. Public savings is taxes minus purchases and transfers: $1,500 - $1,700 = -$200 billion. National savings is private plus public: $600 + (-$200) = $400 billion.
- C.
- This is private savings alone. The government's deficit is negative saving and lowers the total.
- D.
- This adds the deficit as if it were positive saving. A deficit subtracts from national savings.
- Question 2MKT-4.B.2
An open economy has national savings of $500 billion and a net capital inflow of $120 billion. How much investment can it finance?
- A.$120 billion
- B.$380 billion
- C.$500 billion
- D.$620 billion
Check answerHide answer
Answer: D
- A.
- This counts only the foreign funds. Domestic national savings also finances investment.
- B.
- This subtracts the inflow. Funds coming in from abroad add to the money available for investment.
- C.
- This would be correct for a closed economy. The capital inflow adds $120 billion.
- D.
- Correct. In an open economy, investment equals national savings plus net capital inflow: $500 + $120 = $620 billion.
- Question 3MKT-4.E.2, MKT-4.A.2
The government introduces an investment tax credit. What happens in the loanable funds market?
- A.Demand for loanable funds increases, so the real interest rate and the quantity of loanable funds both rise.
- B.Supply of loanable funds increases, so the real interest rate falls and the quantity rises.
- C.Demand for loanable funds decreases, so the real interest rate and the quantity both fall.
- D.Demand for loanable funds increases, so the real interest rate rises and the quantity falls.
Check answerHide answer
Answer: A
- A.
- Correct. The credit lowers the cost of new capital, so firms want to borrow more at every real rate. Demand shifts right along an upward-sloping supply curve, raising both the rate and the quantity.
- B.
- The tax credit changes what borrowers want. Savers' behavior is unchanged, so the supply curve stays put.
- C.
- Making investment cheaper raises borrowing. Demand increases.
- D.
- When demand shifts right along an upward-sloping supply curve, the quantity rises.
- Question 4MKT-4.A.3, MKT-4.A.1
Why does the supply of loanable funds slope upward?
- A.A higher real interest rate makes more investment projects profitable.
- B.The central bank adds reserves when the real interest rate rises.
- C.A higher real interest rate rewards saving, so savers offer more funds.
- D.A higher real interest rate lowers the price level.
Check answerHide answer
Answer: C
- A.
- A higher rate makes fewer projects profitable, which is why demand slopes downward.
- B.
- The loanable funds supply curve describes savers, not central bank reserve policy.
- C.
- Correct. The supply side of the market is savers. When lending pays a higher real return, households and firms save and lend more.
- D.
- The price level is not on this graph. The slope comes from savers responding to the real return.
- Question 5MKT-4.E.1, MKT-4.D.1, MKT-4.C.1
The loanable funds market starts in equilibrium. The government then borrows more to cover a larger budget deficit, and the change is shown as an increase in the demand for loanable funds. At the original real interest rate, what exists, and what happens next?
- A.A surplus of loanable funds exists, and the real interest rate falls.
- B.A shortage of loanable funds exists, and the real interest rate falls.
- C.The market stays in equilibrium, because government borrowing does not change the real interest rate.
- D.A shortage of loanable funds exists, and the real interest rate rises.
Check answerHide answer
Answer: D
- A.
- A surplus would mean savers offer more than borrowers want. Extra government borrowing does the opposite.
- B.
- A shortage pushes the price of borrowing up. The real rate rises.
- C.
- The loanable funds market shows how government borrowing affects interest rates. More borrowing raises the real rate.
- D.
- Correct. At the old rate, borrowers now want more funds than savers offer, which is a shortage. Borrowers compete for the limited funds and bid the real rate up until the quantities match again.
- Question 6MKT-4.E.2
Households decide to save a larger share of their income. At the same time, firms become pessimistic about future sales and cut planned investment. What happens to the equilibrium real interest rate and the quantity of loanable funds?
- A.The real interest rate rises, and the quantity rises.
- B.The real interest rate falls, and the change in quantity cannot be determined.
- C.The real interest rate falls, and the quantity rises.
- D.The change in the real interest rate cannot be determined, and the quantity falls.
Check answerHide answer
Answer: B
- A.
- Both shifts lower the real interest rate, so the rate cannot rise.
- B.
- Correct. More saving shifts supply right, which lowers the rate and raises the quantity. Pessimistic firms shift demand left, which lowers the rate and lowers the quantity. Both lower the rate. Their effects on quantity work against each other, so the quantity is uncertain.
- C.
- The supply shift raises the quantity and the demand shift lowers it. Without the sizes of the shifts, the quantity is uncertain.
- D.
- The rate is certain to fall because both shifts push it down. The quantity is the uncertain one.
Practice every topic in Unit 4
CED Codes
MKT-4.A.1 · MKT-4.A.2 · MKT-4.A.3 · MKT-4.B.1 · MKT-4.B.2 · MKT-4.C.1 · MKT-4.D.1 · MKT-4.E.1 · MKT-4.E.2