5.6 Economic Growth
Measure growth as the rise in real GDP per capita, calculate it from data, and see how productivity, capital, technology and the PPC tie to LRAS.
Part 1 of 3 Measuring Growth
Economic growth is measured as the growth rate of real GDP per capita over time. Real GDP per capita is real GDP divided by the population: the output per person, with inflation removed. Dividing by population matters because an economy whose output grows 2% while its population grows 2% gives each person no more goods.
| Year | Real GDP | Population | Real GDP per capita |
|---|---|---|---|
| Year 1 | $400 billion | 10 million | $40,000 |
| Year 2 | $420 billion | 10.2 million | about $41,176 |
Real GDP grew 5%, from $400 billion to $420 billion. Real GDP per capita grew from $40,000 to about $41,176, which is ($41,176 - $40,000) / $40,000 x 100, or about 2.9%. The 2.9% is Ostmere's rate of economic growth. Population grew 2%, so output per person grew more slowly than total output.
Part 2 of 3 The Aggregate Production Function
Firms need more workers to produce more output, holding other factors constant, so aggregate employment and aggregate output move together. The aggregate production function captures that link. The curve rises as employment rises, and it flattens, because each extra worker has less capital to work with.
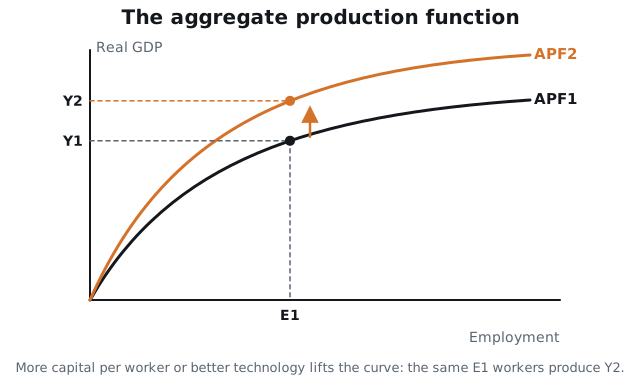
Labor productivity is output per employed worker, a measure of average productivity. Ostmere's $420 billion produced by 5 million workers is $84,000 per worker. Productivity depends on three things: the level of technology, physical capital per worker and human capital per worker. Output per person rises with both physical and human capital per person.
| Source | Example |
|---|---|
| Physical capital per worker | A bakery adds a second oven for its three bakers |
| Human capital per worker | Nurses complete training on a new heart monitor |
| Technology | Software routes delivery vans with fewer wasted miles |
Part 3 of 3 Growth on the PPC and LRAS
Economic growth appears on two graphs from earlier units. An outward shift of the production possibilities curve corresponds to a rightward shift of the long-run aggregate supply curve. Both show the same event: the economy can now produce more at full employment.
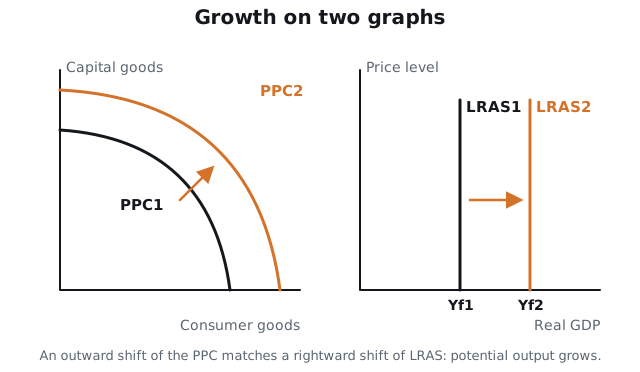
Economic growth is a rise in real GDP per person. Productivity, driven by capital and technology, is what makes it last.
Key Terms
Practice Questions
6 questions. Nothing here is recorded or scored.
- Question 1MEA-2.B.1
Growth in Halvard
Data for the imaginary country of Halvard. Year 1: real GDP $600 billion, population 20 million, employed workers 8.5 million. Year 2: real GDP $630 billion, population 20.4 million, employed workers 9 million.
By about what percentage did Halvard's real GDP per capita grow from Year 1 to Year 2?
- A.About 2.0%
- B.About 2.9%
- C.About 5.0%
- D.About 7.0%
Check answerHide answer
Answer: B
- A.
- This is the population growth rate. Economic growth is measured per person.
- B.
- Correct. Real GDP per capita rose from $600 billion / 20 million = $30,000 to $630 billion / 20.4 million = about $30,882. The growth rate is ($30,882 - $30,000) / $30,000 x 100, about 2.9%.
- C.
- This is the growth of total real GDP. Population also grew, so output per person grew less.
- D.
- This adds the growth of real GDP and of population. Dividing by a larger population lowers per capita growth.
- Question 2MEA-2.B.3
What was Halvard's labor productivity, measured as output per employed worker, in Year 2?
- A.$7,000
- B.$30,882
- C.$63,000
- D.$70,000
Check answerHide answer
Answer: D
- A.
- This drops a zero. $630,000,000,000 / 9,000,000 = $70,000.
- B.
- This is real GDP per capita, which divides by the whole population. Productivity divides by employed workers.
- C.
- This divides by 10 million workers. Halvard employed 9 million in Year 2.
- D.
- Correct. Labor productivity is output per employed worker: $630 billion / 9 million workers = $70,000.
- Question 3MEA-2.B.4
Which of the following would most directly raise labor productivity at a bakery?
- A.The bakery buys a faster mixer for each of its bakers.
- B.The bakery hires two more bakers and buys no new equipment.
- C.The price of bread rises by 10%.
- D.The town's population grows while the bakery's output stays the same.
Check answerHide answer
Answer: A
- A.
- Correct. Productivity depends on technology and on physical and human capital per worker. A better mixer for each baker raises physical capital per worker, so each baker produces more.
- B.
- More workers sharing the same equipment lowers capital per worker, which tends to lower output per worker.
- C.
- A higher price raises revenue and leaves the amount each baker produces unchanged.
- D.
- Population does not change output per worker at the bakery.
- Question 4MEA-2.B.2
Technology and capital stay the same, and firms hire more workers. How is this shown with the aggregate production function?
- A.The aggregate production function shifts up.
- B.The aggregate production function shifts down.
- C.Real GDP rises along the existing aggregate production function.
- D.Real GDP stays the same because technology did not change.
Check answerHide answer
Answer: C
- A.
- The curve shifts up only when technology or capital per worker improves.
- B.
- A downward shift would require a loss of technology or capital.
- C.
- Correct. The aggregate production function links employment to output, holding technology and capital constant. More employment moves the economy along the curve to a higher output.
- D.
- More workers produce more output even with the same technology. The gain from each extra worker gets smaller as the curve flattens.
- Question 5MOD-1.C.1
An economy's production possibilities curve shifts outward. Which change in the AD-AS model corresponds to this shift?
- A.The long-run aggregate supply curve shifts to the left.
- B.The long-run aggregate supply curve shifts to the right.
- C.The aggregate demand curve shifts to the right.
- D.The economy moves up along the short-run aggregate supply curve.
Check answerHide answer
Answer: B
- A.
- A leftward shift of LRAS matches an inward shift of the PPC.
- B.
- Correct. An outward PPC shift means the economy can produce more at full employment. On the AD-AS graph, that is a rightward shift of LRAS.
- C.
- A change in aggregate demand does not change what the economy can produce at full employment.
- D.
- A move along SRAS is a short-run change in output. The PPC shift is a change in potential output.
- Question 6MEA-2.B.5, MEA-2.B.4
Countries R and S have the same population and the same technology. Country R has more physical capital per person and more years of schooling per person. Which of the following is most likely true?
- A.Country S has higher output per capita than Country R.
- B.The two countries have the same output per capita, because their populations are equal.
- C.Country R has higher output per capita than Country S.
- D.Country R has higher output per capita only if it also has a larger population.
Check answerHide answer
Answer: C
- A.
- Country S has less physical and human capital per person, so it is likely to produce less per person.
- B.
- Equal populations do not mean equal output. Capital per person also determines output per person.
- C.
- Correct. Output per capita rises with both physical and human capital per capita. Country R has more of each, so each person in R produces more on average.
- D.
- A larger population with the same capital would lower capital per person and output per person.
Practice every topic in Unit 5
CED Codes
MEA-2.B.1 · MEA-2.B.2 · MEA-2.B.3 · MEA-2.B.4 · MEA-2.B.5 · MOD-1.C.1